

Predictive Financial Intelligence for Founders, VCs, SMBs, and CAS Firms
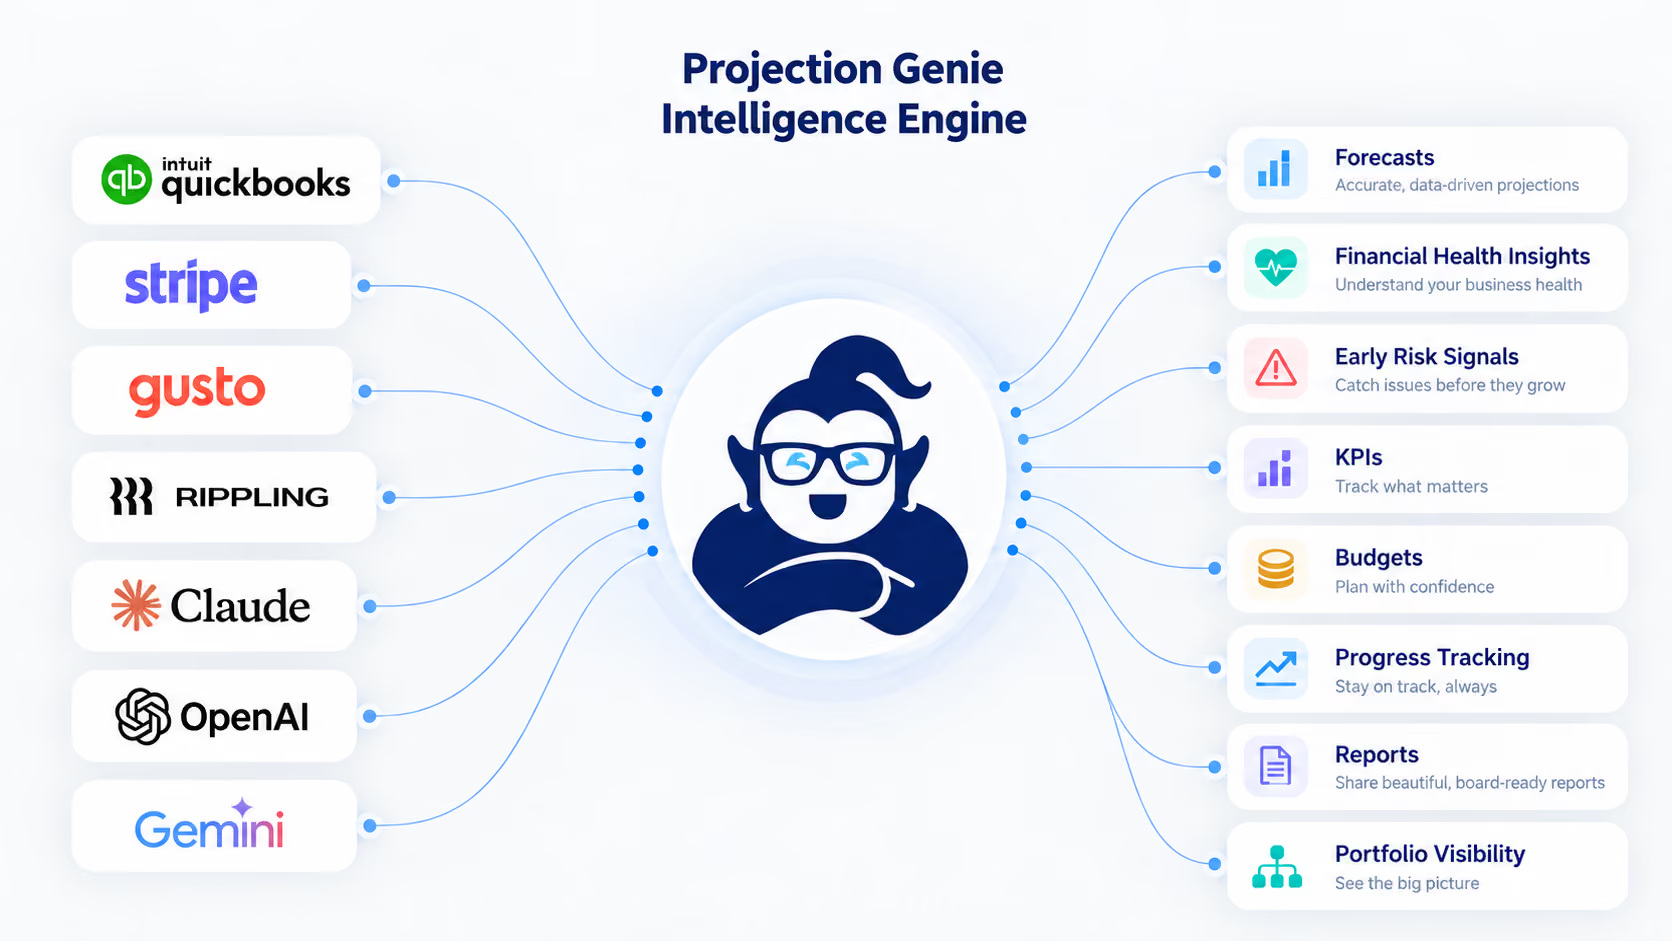
Projection Genie automatically makes sense of your financial, sales, and workforce data so you don't have to. Get done-for-you forecasts, financial health insights, and early risk signals. Then put that intelligence to work by easily modeling how decisions around hiring, pricing, spending, and growth may affect future revenue, cash flow, and profitability before making them—for one business or an entire portfolio.

Trusted by users from 40+ countries



One Platform. Intelligence for All.
Whether you're managing a startup, small business, advising clients, or overseeing a VC investment portfolio, Projection Genie makes it easier to understand financial performance, anticipate risks, and plan for what's ahead without the cost or complexity of enterprise solutions.



A Trusted QuickBooks App Partner
As an Intuit App Partner Program silver tier member, RunSmart has passed Intuit’s rigorous technical and security reviews, meeting their standards for reliability, security, and seamless QuickBooks Online integration.

Real Insights. Real Decisions.

"What impressed me most is how easy it is. I don't have to build complex models again."
Brad Kingsford
CPA
"I can scan my entire client base and quickly spot where margins are projected to tighten without digging into each set of financials."
Ashley Chen
CPA
"I’m not building models or digging through reports anymore—it’s already laid out for me."
Brian O’Connor
CFO
"I don’t have to rebuild models just to answer basic ‘what happens if this changes’ questions."
Samantha Lee
Bookkeeper
"I save a ton of time on monthly reviews now. Most of the work is already done when I log in."
Daniel Brooks
Accounting Firm Owner
"It’s straightforward and easy to use. I didn’t have to spend time figuring things out."
Michael Patel
Small Business Owner
"Portfolio View is probably my favorite part. I can quickly see what’s going on across all my clients."
Misty Callen
Senior Advisor
"The forecasting alone is a game changer. I don't have to build or model anything manually and its so much more reliable then what I've seen from others."
Kassi Ramirez
Fractional CFO

